
Pivot tables in Microsoft Access are a powerful tool designed to summarize large amounts of data without requiring extensive programming. They provide a flexible interface for data analysis, enabling users to convert rows into columns, filter out unnecessary data, and aggregate values in a meaningful way. The concept of Microsoft Access pivot tables revolves around transforming data to view it from different perspectives, thus aiding in better decision making and reporting.
What is a Microsoft Access Pivot Table?
A Microsoft Access pivot table is essentially a data summarization tool that can sort, count, total, or average data stored in a database. It allows users to gain a comprehensive understanding of the data by allowing for dynamic rearrangement of information. This makes Microsoft Access pivot tables an invaluable feature for anyone dealing with significant amounts of data.
How to Create a Pivot Table in Microsoft Access
Creating a pivot table in Microsoft Access involves several steps:
- Select the Data: Choose the data source from which you want to create the pivot table. This could be a table or a query.
- Arrange Fields: Drag and drop fields into different areas of the pivot table layout. Typically, fields are placed into row, column, or value areas.
- Customize Data Display: Adjust how the data is summarized, such as summing numbers, counting items, or averaging values.
- Filter and Sort: Apply filters to focus on specific data and sort the results to enhance readability.
Benefits of Using Pivot Tables in Microsoft Access
There are several benefits to using pivot tables in Microsoft Access:
- Enhanced Data Analysis: Quickly summarize large datasets and gain insights into trends and patterns.
- Time Efficiency: Save time on complex calculations and data arrangement. Pivot tables automate many repetitive tasks involved in data analysis.
- Dynamic Data Handling: Easily adjust views and data summaries with a few clicks. Pivot tables allow users to experiment with different data arrangements to explore various insights.
- Improved Decision Making: Support decision-making processes with better data visualization. Pivot tables present information in a clear and organized manner, making it easier to identify key trends and make informed decisions.
Comparing Microsoft Access Pivot Tables with Crosstab Queries
While Microsoft Access pivot tables offer a highly interactive way of exploring data, Crosstab queries in Microsoft Access provide a more static form of data summarization. Crosstab queries, similar to pivot tables, allow for the transformation of rows into columns, summarizing data based on row and column headings.
What is a Crosstab Query?
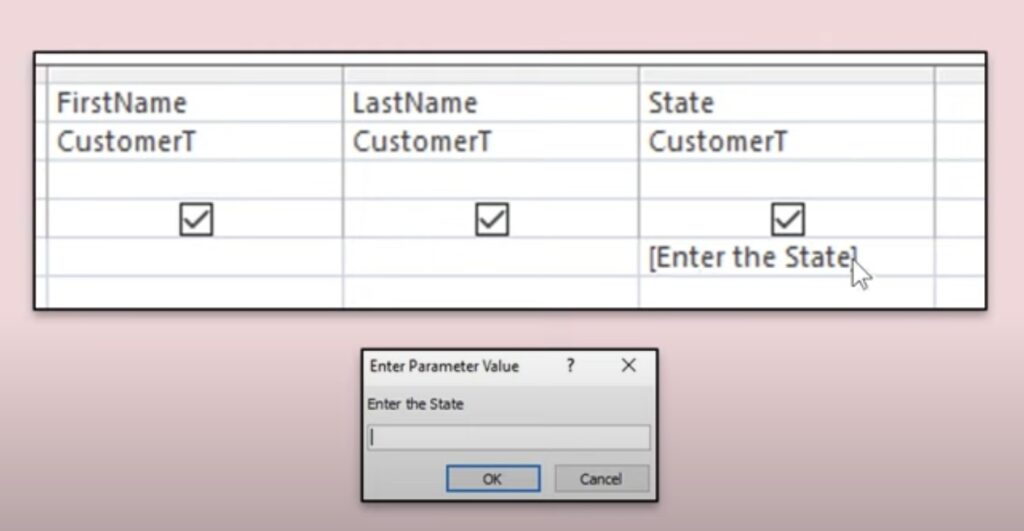
A Crosstab query in Microsoft Access creates a cross-tabulation of data similar to a spreadsheet pivot table. It displays data along two axes and allows for computing aggregate data at the intersection of these axes. Crosstab queries are particularly useful when you need to analyze relationships within your data. Essential characteristics of a Crosstab Query include:
- Data Aggregation: One of the primary functions of a Crosstab query is to aggregate data. It calculates summary values for the intersections of row and column headings. These summary values can include counts, sums, averages, minimums, maximums, or other aggregate functions applied to the data.
- Dynamic Structure: Unlike traditional queries where the structure is fixed, Crosstab queries dynamically adjust their structure based on the data being analyzed. The rows and columns are determined by the unique values in the selected fields, allowing for a flexible analysis of various combinations of data.
- Row and Column Headings: Row and column headings in a Crosstab query represent the categories or groups of data being analyzed. These headings are derived from the values in the selected fields and provide a structured way to organize and interpret the data.
- Cross-Tabulation: The core function of a Crosstab query is to perform cross-tabulation, which involves summarizing data by both rows and columns simultaneously. This allows users to observe relationships and patterns within the data across different dimensions.
Key Differences Between Pivot Tables and Crosstab Queries
Pivot tables and Crosstab queries exhibit contrasting features and functionalities. Here’s a detailed comparison:
- Interactivity: Pivot tables are generally more interactive, allowing for on-the-fly adjustments, whereas Crosstab queries are set once run.
- Ease of Use: Pivot tables might require some initial learning but are more versatile, while Crosstab queries are simpler but with less flexibility.
- Visualization: Pivot tables provide better visualization options, such as conditional formatting and chart integration.
Working with Microsoft Access Pivot Tables

Here are a few tips for optimizing your experience with Microsoft Access pivot tables:
Data Preparation
Before creating a pivot table in Microsoft Access, it’s crucial to ensure that your data is clean, consistent, and well-organized. This includes:
- Removing any duplicate records or entries.
- Checking for and correcting any errors or inconsistencies in the data.
- Ensuring that each column has a clear and consistent format, such as dates in a standardized format, and numeric data formatted consistently.
Here’s an example of how you might prepare your data in Microsoft Access before creating a pivot table:
| ID | Name | Date | Amount |
| 1 | John | 2023-01-01 | 100 |
| 2 | Alice | 2023-01-02 | 150 |
| 3 | Bob | 2023-01-03 | 200 |
| 4 | John | 2023-01-04 | 120 |
| 5 | Alice | 2023-01-05 | 180 |
| 6 | Charlie | 2023-01-06 | 220 |
Field Arrangement
Once your data is prepared, you can begin creating pivot tables in Microsoft Access. Experiment with different field arrangements to find the most insightful way to present your data. This might involve:
- Dragging and dropping fields into different areas of the pivot table to see how they interact.
- Grouping fields together to create hierarchical structures.
- Changing the order of fields to emphasize different aspects of the data.
For example, you might arrange your pivot table like this to analyze sales data by employee and month:
| Row Labels | Column Labels | Sum of Amount |
| Jan | Feb | |
| John | $100 | $120 |
| Alice | $150 | $180 |
| Bob | $200 | – |
| Charlie | $220 | – |
Filtering
Filters allow you to drill down into your data and focus on specific subsets of information. In Microsoft Access pivot tables, you can apply filters to:
- Limit the data displayed in the pivot table to specific criteria, such as a particular date range or category.
- Exclude or include specific data points from the analysis.
- Filter by multiple criteria to narrow down your results even further.
Conclusion
Microsoft Access pivot tables and Crosstab queries offer robust solutions for data analysis within the Access environment. Whether you choose the dynamic approach of pivot tables or the straightforward method of Crosstab queries, both tools provide effective ways to analyze and interpret your data. As technology continues to advance, the power of data transformation in Access remains a critical skill for data analysts and business professionals alike.
FAQ
A1: Yes, you can create a pivot table from tables or queries in Microsoft Access, provided the data is organized in a compatible format.
A2: You can refresh your pivot table by right-clicking within the pivot table and selecting the ‘Refresh’ option. This ensures that your pivot table reflects the most current data.
A3: Yes, Microsoft Access pivot tables can be exported to Excel for further analysis or reporting purposes. Use the ‘External Data’ tab and select the appropriate export option.
A4: While Microsoft Access pivot tables are robust, they are best used with datasets that fit within the size limits of Access databases (2 GB). For larger datasets, consider using SQL Server with Access as a front end.